Python - Factor Identification Analysis on a Small-Sample Dataset

I used Python for my capstone project titled Factors Influencing Bid Outcomes in Road and Building Construction Projects: An Exploratory Machine Learning Analysis on Small-Sample SME Data. It is a factor identification study, analyzing a small-sample dataset (n=30) and exploring which bidding factors have a significant impact on bid outcomes through the use of machine learning. The objective is to help Company XYZ increase its chance of winning more construction projects in public bidding.
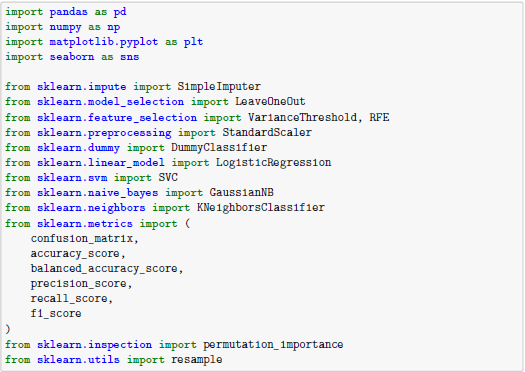
The code snippet above shows the Python libraries appropriate for the study's objectives. It includes Pandas, NumPy, Matplotlib, Seaborn, and Scikit-learn (sklearn).
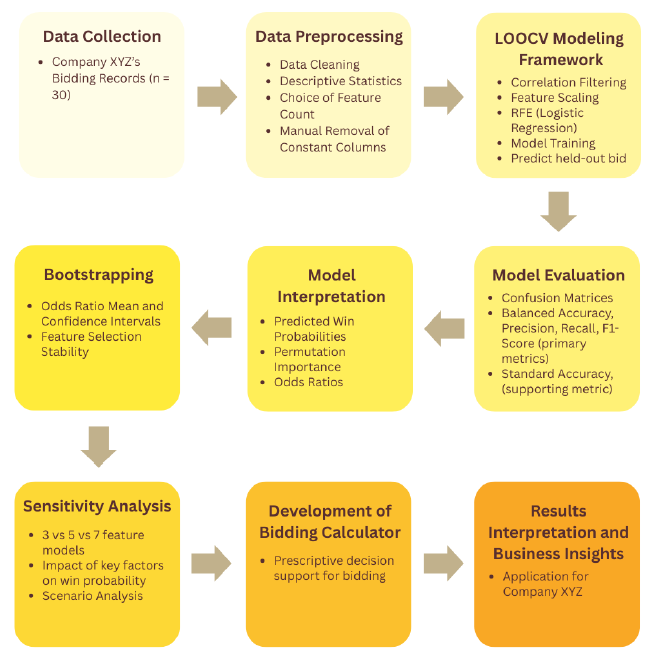
Features Selected Across LOOCV
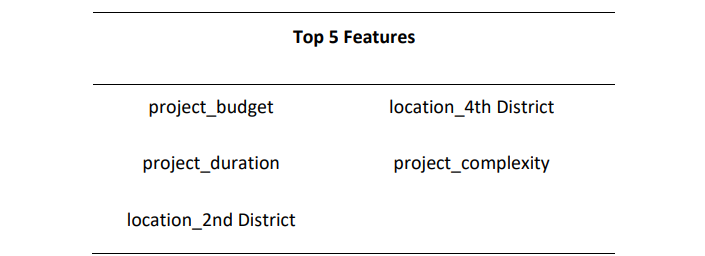 Project budget, project duration, location (2nd District), location (4th District), and project complexity are the top five most frequently selected features across LOOCV. The features underwent correlation filtering, feature scaling, and RFE (logistic regression) to derive these findings.
Model Performance
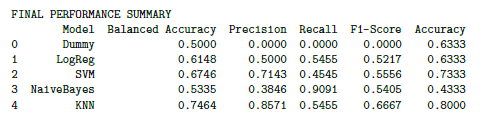
Model training consists of four machine learning algorithms appropriate for a small-sample binary classification problem. It also includes the dummy classifier, which serves as a baseline benchmark that dumbly predicts the majority class (loss) most of the time. As seen above, K-Nearest Neighbors (KNN) outperforms the other ML classifiers on almost all metrics. With k = 3, this champion model achieves 74.64% balanced accuracy, exceeding the performance score of the dummy model by 24.64%. High precision was noted, indicating less risk of losing bids and more controlled bid preparation costs, as there is an 85.71% chance that a predicted “win” is correct. Meanwhile, due to the trade-off, a moderately low recall (54.55%) is observed, signifying some missed winning opportunities. The accuracy of 80% indicates a good performance as a whole on the five selected features.
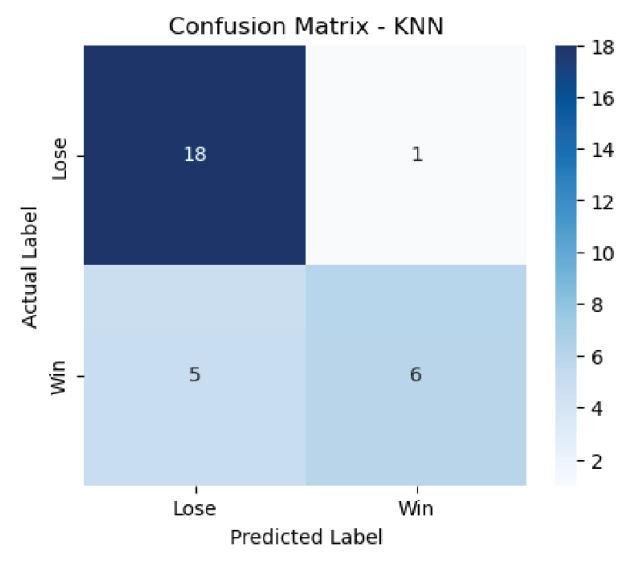
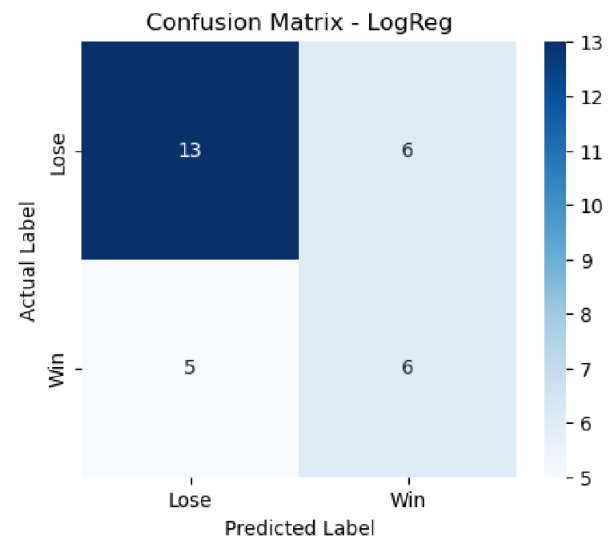
Among the 30 projects in the dataset, there were 19 losses and 11 wins. The confusion matrix of K-Nearest Neighbors (KNN) shows the correct classification of 18 losses out of 19 actual ones and 6 predicted wins versus 11 actual wins. Meanwhile, the confusion matrix of Logistic Regression presents correctly classified bid outcomes: 13 predicted losses versus 19 actual losses, and 6 predicted wins versus 11 actual wins.
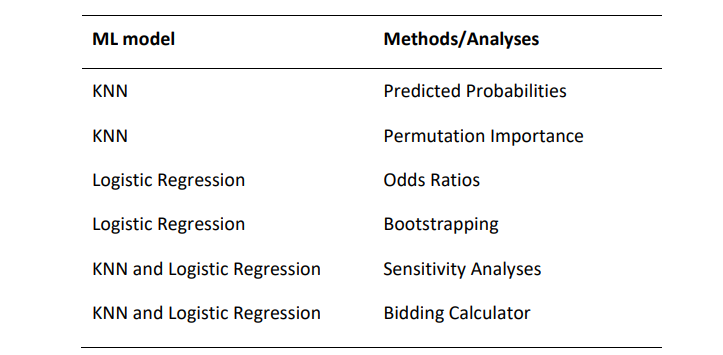
From here on, a Dual-Engine Analytical Framework is introduced, utilizing both K-Nearest Neighbors (KNN) and Logistic Regression to achieve the study's objectives. KNN was applied to generate win probability estimates, perform permutation importance and sensitivity analyses, and develop the bidding calculator. Conversely, Logistic Regression was in charge of odds ratios, bootstrapping, some aspects of sensitivity analyses, and supplementary probability estimates in the bidding calculator. This contingent Dual-Engine Analytical Framework explored the importance, stability, and impact of the identified factors on the bid outcomes.
Dual-Engine Analytical Framework
Permutation Importance
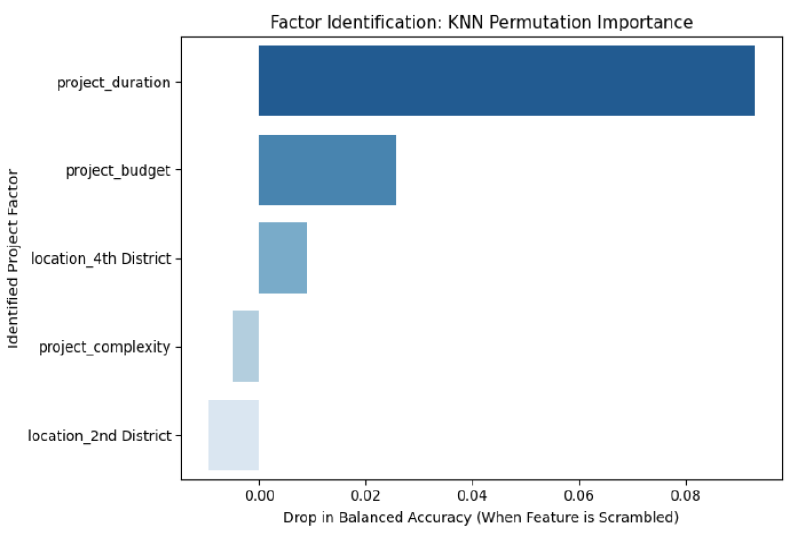
Among the top five features, project duration has the highest mean importance, which drops the KNN model’s balanced accuracy by 9.31%, indicating its substantial influence on bid outcome. Project budget is also significant to the model, as seen in the 2.56% drop in balanced accuracy. On the other hand, location (4th District) only has a small contribution to predicting bid outcomes. Regarding the other features’ negative importance, project complexity and location (2nd District) confuse the model, but shuffling them destroys spatial noise. They improve the KNN model at classifying bid outcomes, especially when the two most important features, namely project duration and project budget, are considered in predictive performance.
Odds Ratios
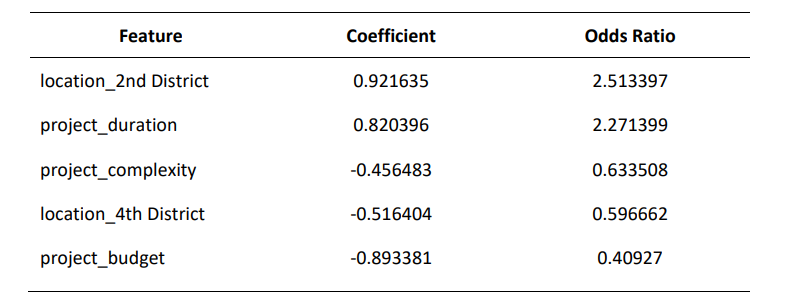 The odds ratio measures how a feature is associated with certain odds of winning. The
feature “location_2nd District” has a coefficient of 0.92, making it a positive driver, with an
increase in odds of winning by 2.51 times. Compared with the 1st District (reference level),
bidding on a project in the 2nd District gives Company XYZ a better chance of winning. In the
business context, the firm should bid more on projects in the 2nd District due to a more efficient
supply chain, lower transportation costs, and a strong understanding of the market, since
Company XYZ is based in the 2nd District of Iloilo.
Another strong feature is project duration, which implies that an increase in the duration is associated with higher log-odds of a win (coefficient: 0.82). Its odds ratio indicates that a longer time to complete a project multiplies the odds of winning by 2.27 times. Although a shorter duration is preferable in the construction industry, it may be a struggle for a construction SME like Company XYZ. Instead, a longer time for project completion allows the firm to prepare resources and execute plans with stability. This demonstrates Company XYZ’s capability and operational experience in longer projects. However, there is an assumption that a longer duration means a more complex project. The coefficient (-0.456483) and odds ratio (0.633508) for project complexity tell otherwise. They signify that higher technical complexity decreases the odds of winning by 36.65%. Longer duration does not always equate to more complexity, since both project duration and project complexity underwent correlation filtering and were retained from RFE; they are not highly correlated. In light of this, a longer time for project completion and lower complexity are ideal conditions for Company XYZ.
Additionally, holding all other factors constant, moving the project from the reference level (1st District) to the 4th District drops the odds of winning a project by 40.33% (1 - 0.5967). The 4th District could be a highly competitive market for Company XYZ. It could be unfavorable due to operational misalignment, or the SME may have a lower competitive advantage in the 4th District, making it harder to get projects.
Lastly, the coefficient and odds ratio for project budget imply that a larger budget lowers the chance of winning, and a smaller budget is more likely to win. This justifies Company XYZ as an SME. It does not aggressively pursue high-budget projects, as large-scale contractors are attracted to such projects; they can lower bid prices without being affected by tight margins. Overall, Company XYZ must bid on slightly complex projects in the 2nd District with long project completion times, involving low- to mid-budgets.
Bootstrapping
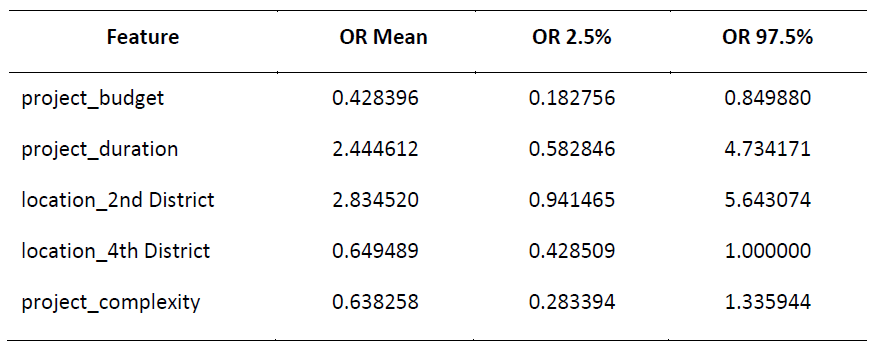
The bootstrapping results consist of the odds ratio (OR) mean and the 95% confidence interval (CI), with OR 2.5% as the lower bound and OR 97.5% as the upper bound. Project budget was found to be the only stable, statistically significant factor due to its CI excluding 1. It supports the idea that Company XYZ must not bid on high-budget projects, as large budgets are consistently associated with lower odds of winning. In addition, project duration and location (2nd District) are linked to higher odds of winning a project; however, their confidence intervals include 1, making them not statistically significant. They can still be viewed as exploratory drivers, as the project duration achieved a score of 0.0931 in Permutation Importance, while the location (2nd District) has a lower bound that is close to or could have been greater than 1 (CI: [0.941465, 5.643074]). Finally, location (4th District) and project complexity turned out to be not statistically significant because their confidence intervals include 1.
Sensitivity Analyses
1) 3 vs 5 vs 7 Feature Models
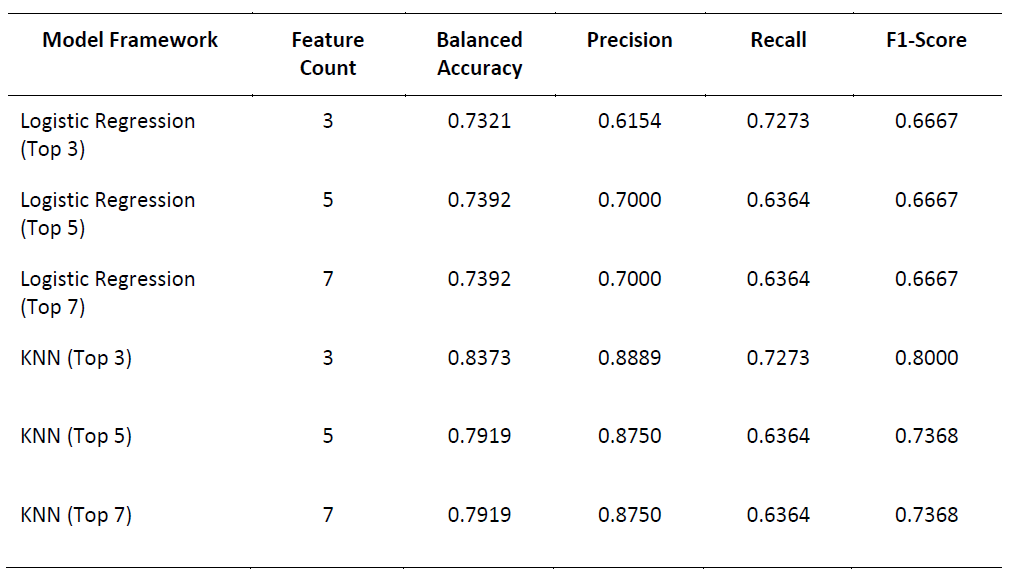
The three feature sets (top 3, 5, and 7 features) underwent feature scaling and model training via Logistic Regression and K-Nearest Neighbors within LOOCV. For Logistic Regression, the 3-feature model is considered aggressive, as it can capture winning opportunities but is prone to wasted bid efforts. The 5-feature model is better than the 3-feature model in terms of balanced accuracy and precision. Adding features from three to five improves the model in controlling bid preparation costs. However, increasing the number of features to seven does not show any changes in performance. Therefore, a 5-feature Logistic Regression model is ideal. Conversely, KNN performs the best with 3 features, achieving the highest performance scores among the three feature sets. Analyzing beyond three features leads to a decrease in performance.
Although a 3-feature KNN model is the top performer, this research initially builds a modeling framework utilizing five features. This was decided from a business analytics standpoint. Given that the 5-feature KNN model has 4.54% less balanced accuracy compared to the 3-feature model, the former was able to explore and assess more features like project complexity and location (4th District). The intentional decision on feature count reflects the exploratory nature of this factor identification research and provides the bidding calculator with more features needed to navigate real-life bidding constraints.
2) Impact of key factors on win probability
In business analytics, the project budget is excluded from this analysis of the impact on win probability, as it is already a widely recognized factor essential to determining the contract winner in construction bidding. This factor is a static constraint based on the procuring entity’s approved budget for the contract (ABC), which managers cannot control. Hence, this study explores the impact of project duration and location (2nd District) as key factors on the win probability.
Project Duration Impact on Win Probability
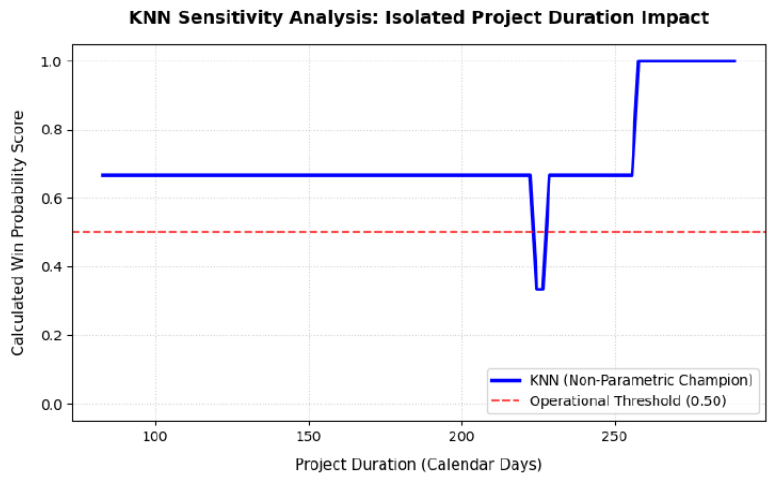
The sensitivity analysis assesses the impact of project duration on win probability using K-Nearest Neighbors. With k = 3, the possible win probabilities that will be output by the model are 0.00, 0.33, 0.67, and 1.00. The above graph shows a stable plateau between 80 and 220 days where projects of such duration have a win probability of 67%. This sensitivity analysis measures the change in the number of days that affects the win probability while the project is in the 2nd District and other factors are constant. Notably, the win probability drops when the project duration is between 220 and 230 days. It results in a 33% win probability, which is below the operational threshold of 50%. Moreover, beyond 255 days, the chance of winning climbs to 100%. This finding encourages Company XYZ to bid on projects with long schedules with certainty and discourages projects that have durations of around 220 to 230 days.
Location Impact on Win Probability
 Under the variable "location," there are five categories: 1st District, 2nd District, 3rd
District, 4th District, and Iloilo City. One-hot encoding was applied to this nominal variable,
assigning the 1st District as the reference level, and the other categories became Boolean values.
Eventually, these potential predictors underwent feature selection methods within LOOCV,
and location (2nd District) and location (4th District) were selected as two of the top five critical
factors. In this sensitivity analysis, the results indicate that when other selected features are fixed
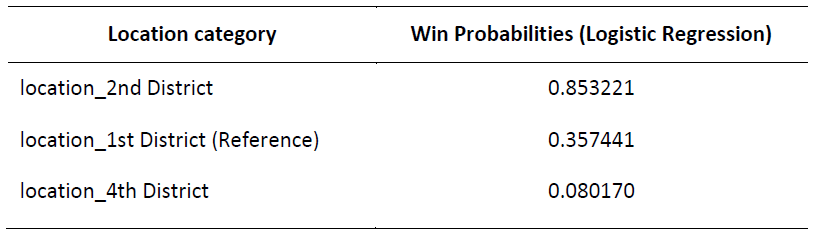
at their averages, the probability of winning when bidding on projects in the 2nd District is 85.32%,
which is higher than the reference level (1st District) of 35.74%. However, it is not recommended
to bid on projects in the 4th District, since its win probability falls to 8.02%.
3) Scenario Analysis
The last component of the sensitivity analysis presents three scenarios to examine the collective impact of the selected features, with their respective inputs, on predicted win probability. The project budget is held constant at the mean because it is a fixed condition that is set by the procuring entity. Company XYZ cannot change this, so it is reasonable to assess how the other selected features affect the win probability while holding the budget intact. Additionally, this study specifies the following three scenarios:
Scenario A: The Optimized Case - a project located within the 2nd District with a long duration and low technical complexity
Scenario B: The Operational Trap - a project located within the 4th District with a short duration and high technical complexity
Scenario C: The Strategic Trade-Off - a project located within the 2nd District with a short duration and average technical complexity
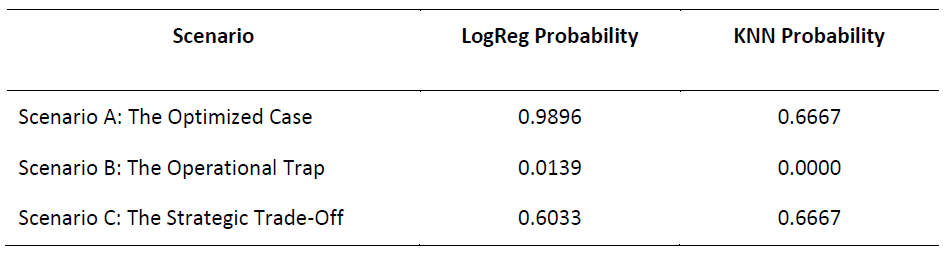
Model findings reveal that Scenario A has the highest win probability (98.96%) across all scenarios using Logistic Regression. It has features with high odds of winning: location (2nd District) has an odds ratio of 2.51, and project duration has a 2.27 odds ratio. Conversely, Scenario A in K-Nearest Neighbors yielded a 0.67 win probability. As previously mentioned, KNN probabilities with k = 3 are among 0.00, 0.33, 0.67, and 1.00. To sum up, Scenario A is a good bidding scenario.
Bidding Calculator
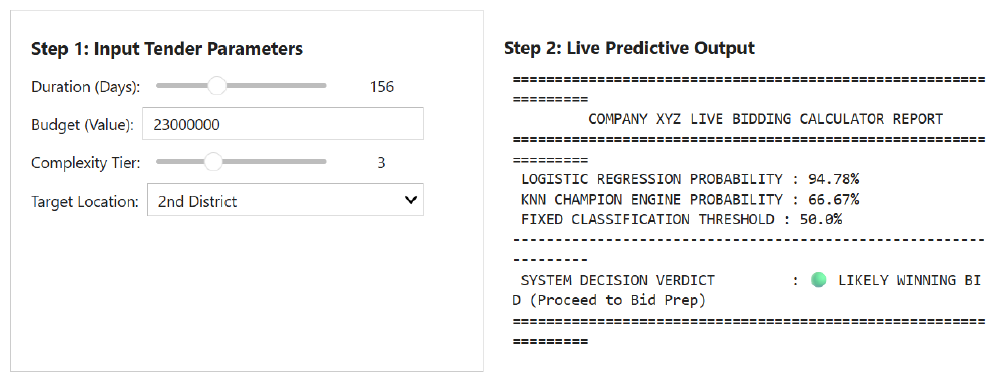
For a prescriptive output, this study presents a prototype, data-driven bidding decision support calculator. This takes the inputs for the critical factors, calculates the win probability, and translates the probability into a system decision verdict (either “Likely Winning Bid” or “Losing Bid Risk Trap”) based on the threshold of 0.50. This operational prototype also provides a recommendation on whether to bid, optimize constraints, or not bid. As can be seen, there are only four input parameters because the target location drop-down menu includes options like the 2nd District, 4th District, and the 1st District (reference level). Duration (days), budget (value), and complexity tier also require inputs to the bidding calculator.
Business Insights
The Dual-Engine Analytical Framework, integrating Logistic Regression and K-Nearest Neighbors (KNN), shows that winning a construction project for a construction SME is not random but shaped by highly distinct operational constraints. Firstly, the project budget is a critical negative constraint for Company XYZ, as supported by its coefficient (-0.8934) and odds ratio (0.4093). The finding that the higher the budget, the lower the odds of winning is solidified further by the stability of project budget in the bootstrapping results, implying that projects with high budgets attract large-scale construction firms more and subject a construction SME like Company XYZ to serious disadvantages.
On the other hand, long project duration acts as a primary operational driver of bid success. The sensitivity analysis on the project duration’s impact on win probability reveals it to be non-linear, with a stable 67% win probability until 220 days and a 100% win probability when the project goes beyond 255 days. Company XYZ can leverage long project schedules, making use of time to estimate pricing and prepare resources productively without being in a rush. With that said, this does not necessarily relate to higher technical complexity, supported by its coefficient (-0.456483) and odds ratio (0.633508), as a highly complex project decreases the odds of winning by 36.65%. The study suggests that a longer time for project completion and lower complexity are ideal conditions for Company XYZ.
Furthermore, location categories were also assessed to see which project sites Company XYZ should ideally pursue. If the SME targets the 1st District of Iloilo, it has a chance of winning at a baseline of 35.74%. However, bidding on projects in the 2nd District instead multiplies the odds of winning by 2.51 times, with a win probability of 85.32%. This explains Company XYZ’s competitive advantage because the SME itself is based in the 2nd District of Iloilo. The firm knows the market so well, leverages the efficient supply chain and low mobilization costs, and may have an established network of people in relation to its operations. Conversely, if road or building projects are situated in the 4th District, a low win probability of 8.02% is observed, which can be due to tight competition and/or operational misalignment with Company XYZ’s strengths.