Data Entry
MS
EXCEL
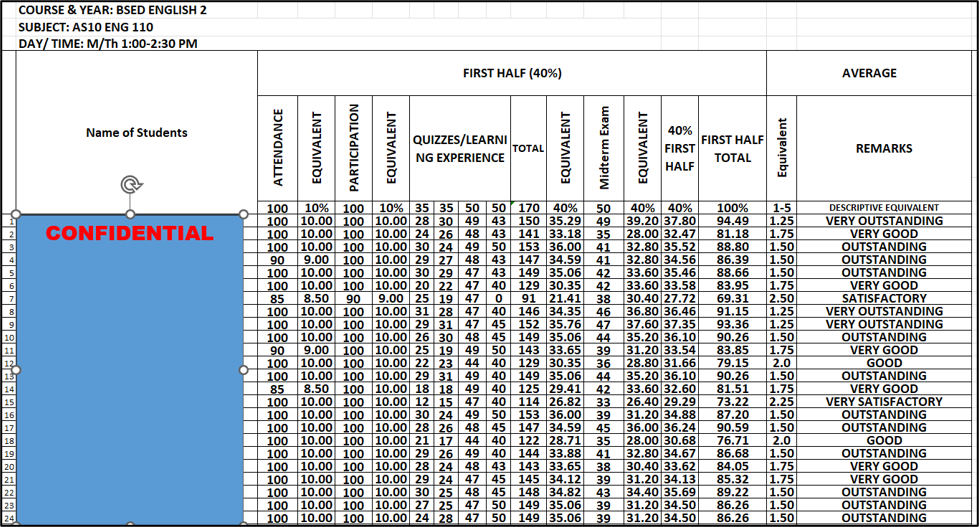
In this electronic grading sheet, student performance for the First Half of the term (constituting 40% of the final grade) is systematically evaluated across four weighted components: Attendance (10%), Participation (10%), Quizzes/Learning Experiences (40%), and the Midterm Examination (40%). Raw scores from these assessments are automatically converted into their respective weighted percentages and summed to generate the First Half Total percentage.
MS
WORD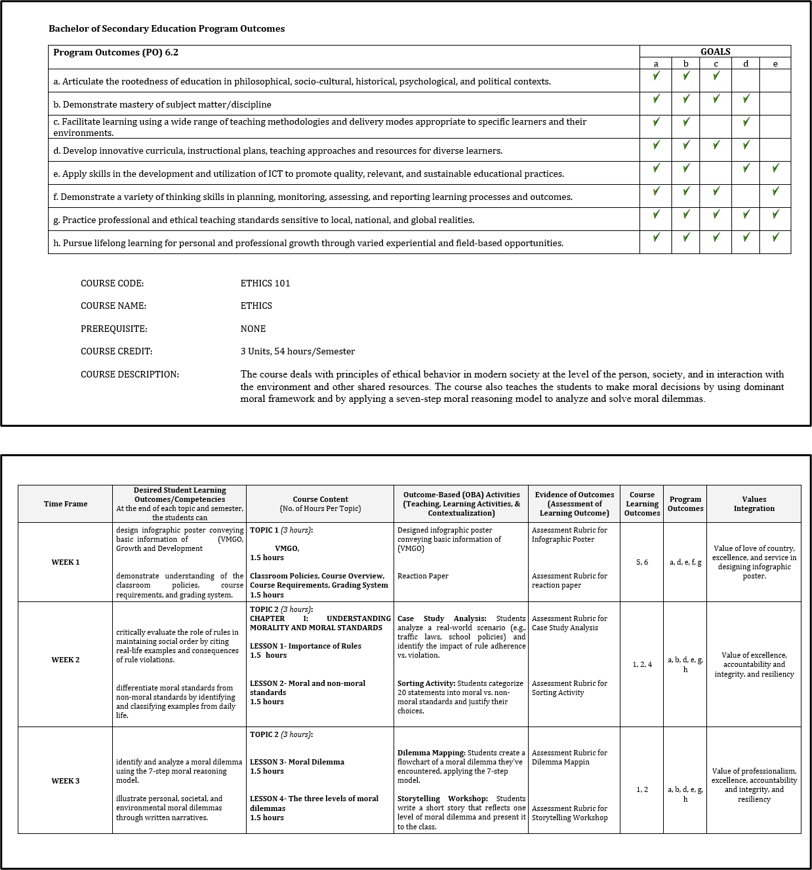
A structured curriculum mapping matrix and course syllabus developed in Microsoft Word. This document showcases advanced text-based data organization and document formatting, utilizing complex multi-column layout tables to systematically categorize weekly learning objectives, course topics, pedagogical methods, and assessment criteria in strict adherence to institutional formatting standards.
MS EXCEL/MS WORD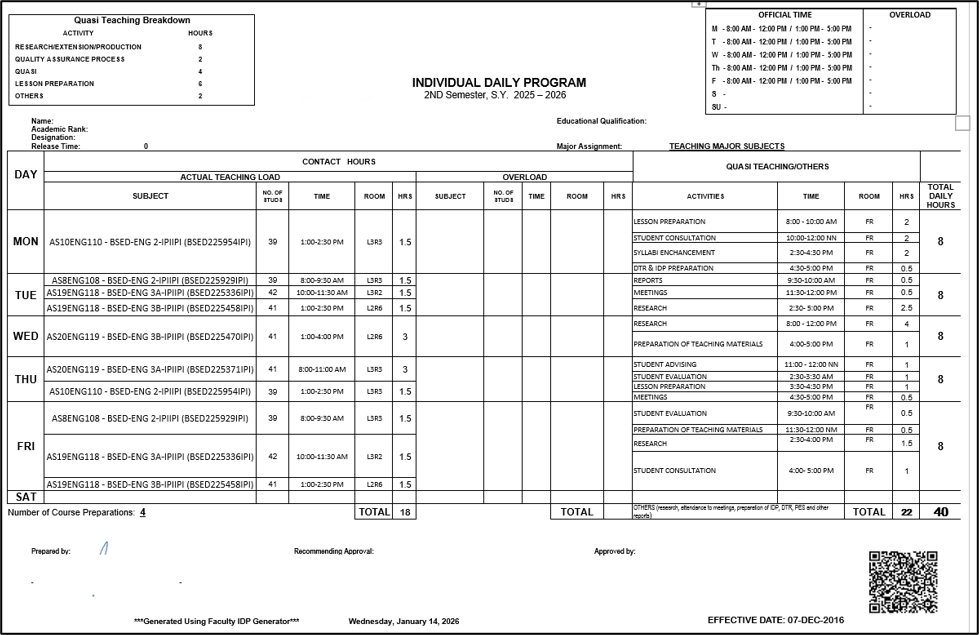 An institutional resource
allocation matrix and daily scheduling program managed in Microsoft Excel. This
document demonstrates advanced spreadsheet structuring, utilizing merged
headers and customized grid layouts to systematically categorize alphanumeric
course codes, room assignments, student headcounts, and time-blocks across a
chronological weekly matrix. The sheet automatically audits and tallies contact
hours, administrative duties, and teaching loads to ensure accurate time
reconciliation against institutional standards.
An institutional resource
allocation matrix and daily scheduling program managed in Microsoft Excel. This
document demonstrates advanced spreadsheet structuring, utilizing merged
headers and customized grid layouts to systematically categorize alphanumeric
course codes, room assignments, student headcounts, and time-blocks across a
chronological weekly matrix. The sheet automatically audits and tallies contact
hours, administrative duties, and teaching loads to ensure accurate time
reconciliation against institutional standards.
MS POWERPOINT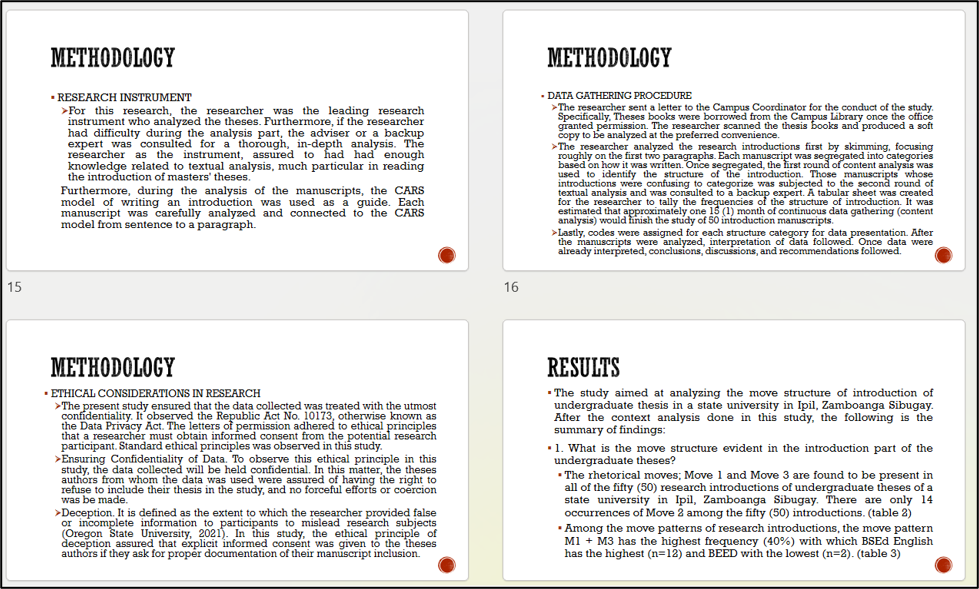
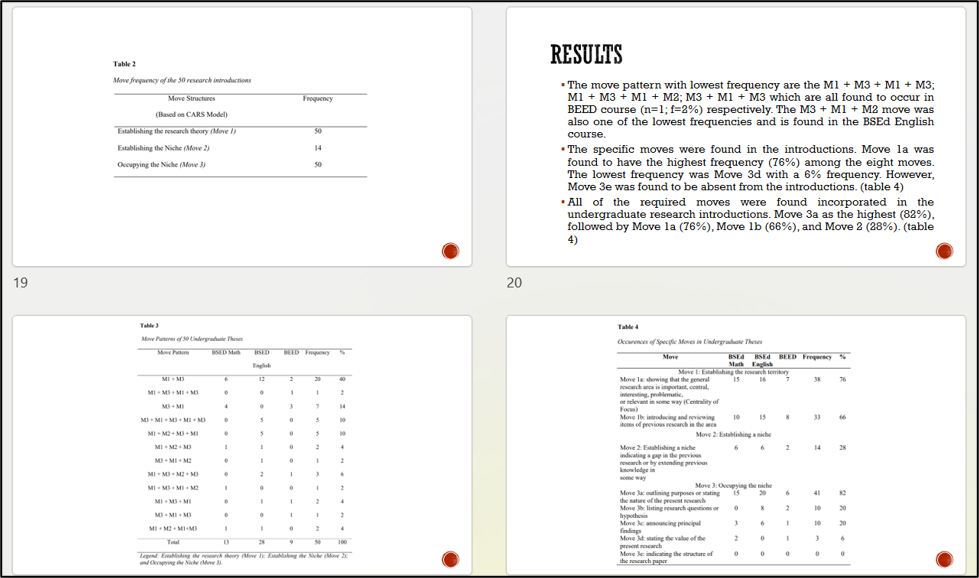 A
research findings and data synthesis presentation deck designed in Microsoft
PowerPoint. This document showcases data coding and tabulation, translating
qualitative content analysis from 50 manuscripts into structured alphanumeric
categories (e.g., rhetorical move patterns and sub-categories). The
presentation utilizes custom layout tables to cross-examine frequency counts
and percentage distributions across multiple degree programs, synthesizing raw
statistical findings into clear visual reports for stakeholder review.
A
research findings and data synthesis presentation deck designed in Microsoft
PowerPoint. This document showcases data coding and tabulation, translating
qualitative content analysis from 50 manuscripts into structured alphanumeric
categories (e.g., rhetorical move patterns and sub-categories). The
presentation utilizes custom layout tables to cross-examine frequency counts
and percentage distributions across multiple degree programs, synthesizing raw
statistical findings into clear visual reports for stakeholder review.
GOOGLE
SHEETS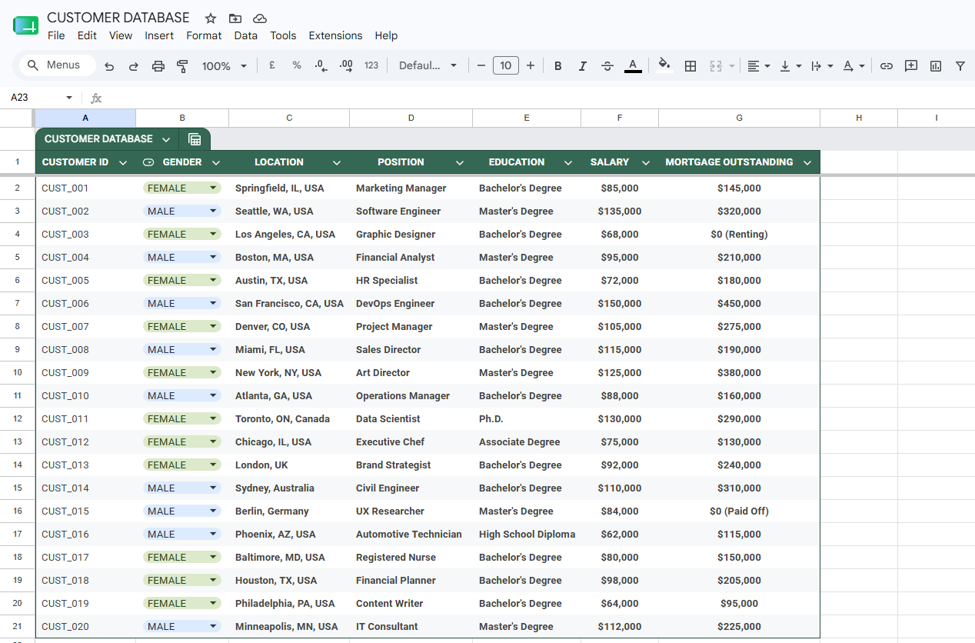 Created a standardized, structured data table in Google Sheets containing 20 customer profiles. The spreadsheet was organized into seven distinct demographic and financial columns: Customer ID, Gender, Location, Position, Education, Salary, and Mortgage Outstanding. All entries were formatted for data consistency and readability to support downstream analysis and testing.
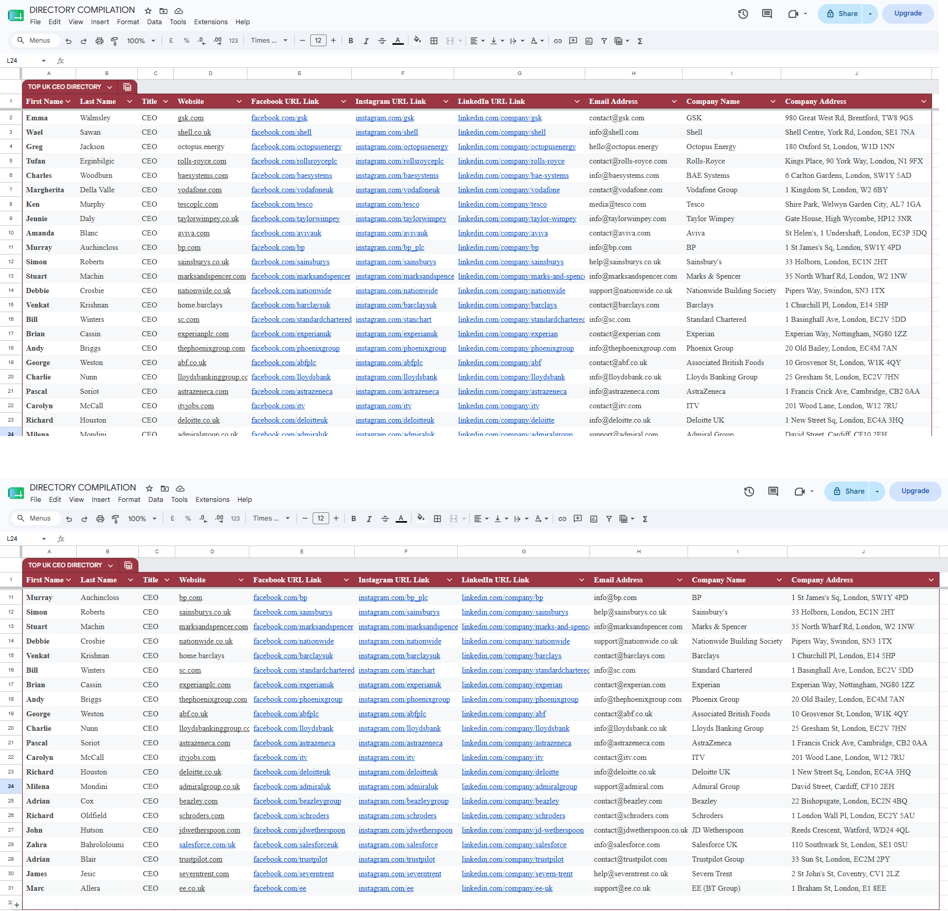 Compiled and formatted a CRM-ready directory of 30 top UK Chief Executive Officers across ten standardized columns in Google Sheets. This process involved parsing executive names for seamless alphabetical sorting, standardizing corporate domains and social URLs for visual uniformity, verifying physical headquarters with UK postcodes, and populating contact fields with compliant corporate inquiry endpoints to ensure data hygiene, accuracy, and immediate database compatibility.